 TestOwl
Dashboard
The Dashboard is typically the first page you'll see after opening a project.
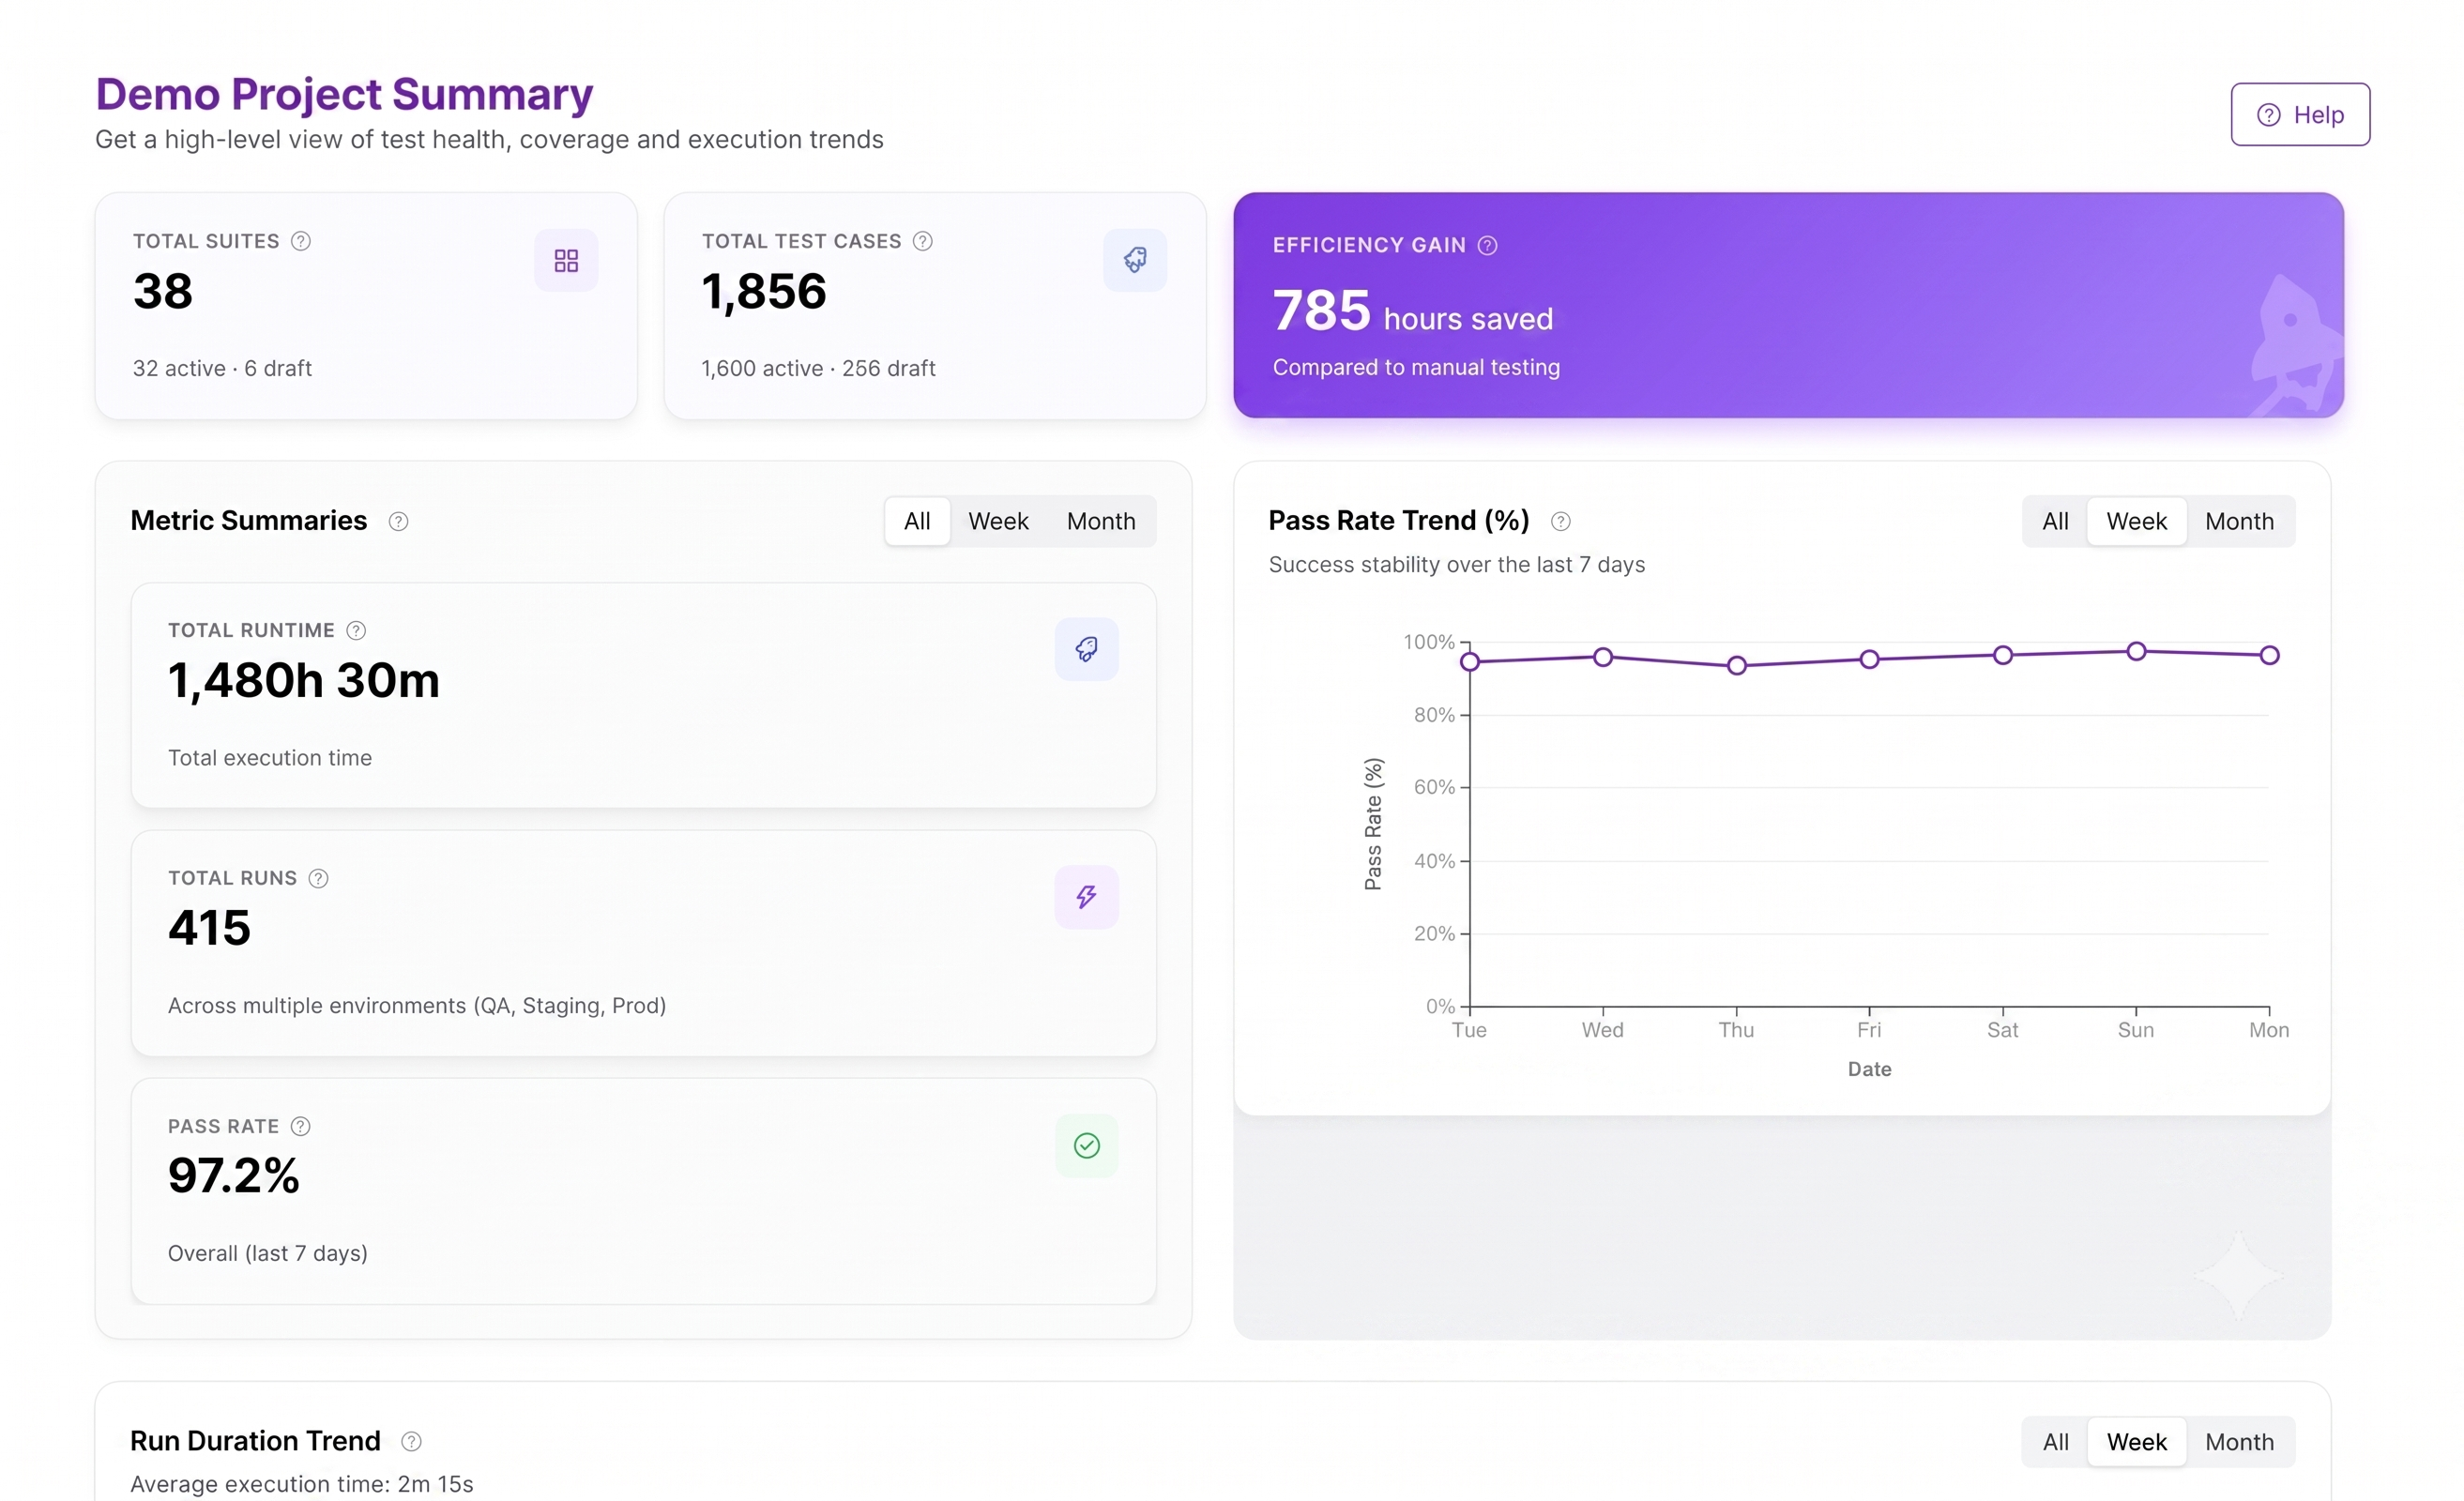
Dashboard overview
The Dashboard contains several sections that summarise the current state of your project.
Project summary
At the top of the page you'll find an overview of your project, including:
- Total Test Suites
- Total Test Cases
- Estimated time saved through automation compared to manual testing
These metrics provide a quick snapshot of the size and impact of your automated test suite.
Metric summaries
The Metric Summaries section displays important execution statistics for the selected time period.
It includes metrics such as:
- Total Runtime
- Total Runs
- Overall Pass Rate
Use the time filter (All, Week, or Month) to analyse recent activity or long-term trends.
Pass Rate Trend
The Pass Rate Trend chart shows how your project's overall pass rate changes over time.
This helps you quickly identify:
- Improvements in test stability
- Recent regressions
- Periods where failures increased unexpectedly
Like the other widgets, the chart can be viewed for All, Week, or Month.
Run Duration Trend
The Run Duration Trend chart tracks how long your test executions take over time.
Monitoring execution duration helps identify:
- Tests that are gradually becoming slower
- Unexpected spikes in execution time
- Improvements after optimisation
Choosing a time range
Most Dashboard widgets support different reporting periods.
You can switch between:
- All
- Week
- Month
Changing the selected period updates the metrics and charts to reflect activity during that timeframe.
Understanding the metrics
Dashboard statistics are calculated using your project's Run History.
Pass rate is calculated from the results of executed Test Cases, giving you an accurate overview of your project's testing health.
When to use the Dashboard
The Dashboard is useful for:
- Monitoring the overall health of your project.
- Tracking testing activity over time.
- Measuring automation progress.
- Identifying changes in pass rate.
- Monitoring execution performance.